
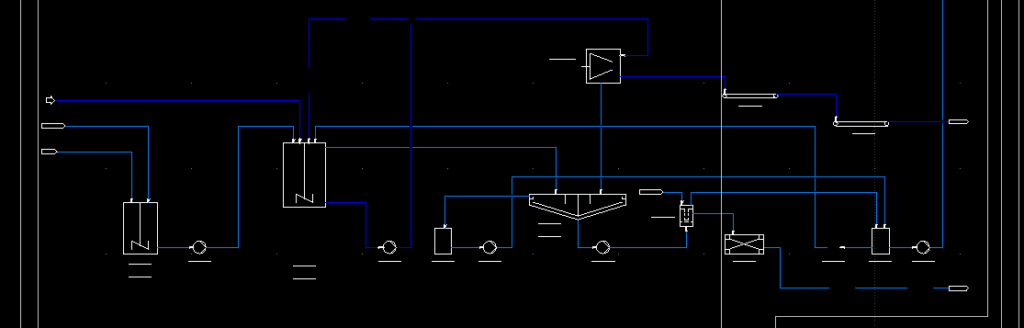
How accurate is PFD Bench?
PFD Bench reads a process flow diagram (DXF) and produces a structured equipment table (SET): every unit, its type, and how it is connected. Based on this table, it then generates a written process description. The quality of the SET is critical for the description outcome: make a few critical mistakes in the SET and the whole description will be wrong.
For this reason, PFD Bench has a Human-In-The-Loop step right after SET extraction, so the user has a chance to correct anything that the AI got wrong. In addition, we run evaluation loops to measure SET extraction quality against reference tables curated by a senior process engineer, on 8 real industrial process flow diagrams. While we cannot share the diagrams with the public (these are under NDA), we can show the evaluation results and rough statistics on how complex each drawing is.
The evaluation is done by processing each drawing 10 independent times (80 runs in total) at the same settings as all users have in PFD Bench. Currently the SETs are processed with Google Gemini 2.5 Pro. The numbers below include the run-to-run spread, so one can see not only the extraction quality on average, but also its variance.
The drawings
Complexity in plain terms: how many equipment units, and how many documented stream connections between them. Density (connections per unit) is what makes a drawing especially hard. Highly interconnected plants are harder to trace than linear trains.
| Drawing | Equipment units | Stream connections | Density |
|---|---|---|---|
| pfd_03 | 8 | 20 | 2.5 |
| pfd_04 | 20 | 53 | 2.6 |
| pfd_05 | 18 | 46 | 2.6 |
| pfd_06 | 19 | 48 | 2.5 |
| pfd_07 | 33 | 175 | 5.3 |
| pfd_08 | 32 | 116 | 3.6 |
| pfd_09 | 29 | 69 | 2.4 |
| pfd_10 | 28 | 83 | 3.0 |
Results
Scores are F1 × 100 (see “How to read these numbers” below), one column per field of the extracted table: mean ± standard deviation over the 10 runs. The closer to 100, the better. Anything above 80 is already an excellent extraction with very few errors.
| Drawing | Tag | Equipment type | Inlet streams | Inlet # | Outlet streams | Outlet # |
|---|---|---|---|---|---|---|
| pfd_03 | 93 ± 8 | 90 ± 14 | 96 ± 6 | 93 ± 8 | 94 ± 7 | 93 ± 8 |
| pfd_04 | 96 ± 3 | 95 ± 5 | 94 ± 3 | 95 ± 5 | 89 ± 2 | 93 ± 5 |
| pfd_05 | 99 ± 3 | 98 ± 3 | 94 ± 6 | 94 ± 3 | 92 ± 5 | 92 ± 6 |
| pfd_06 | 93 ± 1 | 93 ± 1 | 92 ± 5 | 93 ± 2 | 92 ± 6 | 90 ± 3 |
| pfd_07 | 99 ± 1 | 97 ± 4 | 78 ± 9 | 83 ± 17 | 78 ± 9 | 88 ± 15 |
| pfd_08 | 99 ± 1 | 98 ± 2 | 76 ± 3 | 78 ± 9 | 80 ± 3 | 88 ± 10 |
| pfd_09 | 90 ± 7 | 90 ± 7 | 96 ± 5 | 88 ± 7 | 97 ± 2 | 88 ± 7 |
| pfd_10 | 94 ± 5 | 92 ± 9 | 90 ± 6 | 89 ± 7 | 85 ± 5 | 76 ± 7 |
| All drawings (pooled) | 96 | 95 | 86 | 88 | 86 | 88 |
In words: equipment identification is essentially solved. Equipment tags and types land at 95–96% across the set, and on clean drawings at 98–99%. Connectivity mapping runs at 86–90% on typical drawings; the densest, most interconnected plants (pfd_07, pfd_08) pull the stream columns toward 76–80%. Still very good, but it shows that tracing every branch of highly dense diagrams demands further improvements to the models and to how we pre-process the data the LLM is served.
How to read these numbers
Each score is an F1 score, which is the standard accuracy measure for extraction tasks, combining precision and recall into one number (100 = perfect). In our context:
- True positive (TP): something that is on the drawing, and PFD Bench reported it correctly.
- False negative (FN): something on the drawing that PFD Bench missed, e.g. a unit or connection absent from its table.
- False positive (FP): something PFD Bench reported that is not on the drawing. This is also known as “hallucination” in the LLM world.
Precision = of everything reported, how much was right. Recall = of everything on the drawing, how much was found.
F1 is their harmonic mean
F1 = 2 × Precision × Recall / (Precision + Recall)
so a system cannot score well by guessing stuff or by staying silent. Both errors are punished.
Methodology, briefly
- Reference tables: curated against the original drawings. Where several phrasings are equally correct (“Dryer” vs “Drier”, a tag vs its full name), the equivalence was adjudicated once, and applied consistently to every run.
- Deterministic scoring: fixed, version-controlled rules; no AI judges another AI here. Identical output always yields the identical score, reproducible at any point in the project history.
- Every raw model response is archived: any number in this table can be traced back to the exact model output that produced it.
Last update: 2026-08-06
 EN
EN  DE
DE  PT
PT  ES
ES